Review


mouse anti-syt1 antibody cat# 105 311  (Synaptic Systems)


Bioz Verified Symbol Synaptic Systems is a verified supplier

Bioz Manufacturer Symbol Synaptic Systems manufactures this product  

  • Logo
  • About
  • News
  • Press Release
  • Team
  • Advisors
  • Partners
  • Contact
  • Bioz Stars
  • Bioz vStars
  • 90

    Structured Review

    Synaptic Systems mouse anti-syt1 antibody cat# 105 311
    Mouse Anti Syt1 Antibody Cat# 105 311, supplied by Synaptic Systems, used in various techniques. Bioz Stars score: 90/100, based on 1 PubMed citations. ZERO BIAS - scores, article reviews, protocol conditions and more
    https://www.bioz.com/product/mouse+anti-syt1+antibody/synaptophysin+antibody/pmc11933353-49-14-20
    Average 90 stars, based on 1 article reviews
    mouse anti-syt1 antibody cat# 105 311 - by Bioz Stars, 2026-09
    90/100 stars

    Images

    Related Articles

    Expressing:

    Article Title: Vesicle docking and fusion pore modulation by the neuronal calcium sensor Synaptotagmin-1.
    Article Snippet: They were then incubated 505 overnight at 4°C with either mouse anti-Syt1 antibody (1:1000; 105.011, Synaptic Systems) or 506 mouse anti-Syt7 antibody (1:1000; MA5-27654, Synaptic Systems,).

    Article Title: Synaptotagmin oligomerization is essential for calcium control of regulated exocytosis
    Article Snippet: Protein expression was verified by Western blot analysis using a mouse anti-Syt1 antibody (Synaptic Systems).

    Western Blot:

    Article Title: Vesicle docking and fusion pore modulation by the neuronal calcium sensor Synaptotagmin-1.
    Article Snippet: They were then incubated 505 overnight at 4°C with either mouse anti-Syt1 antibody (1:1000; 105.011, Synaptic Systems) or 506 mouse anti-Syt7 antibody (1:1000; MA5-27654, Synaptic Systems,).

    Article Title: Synaptotagmin oligomerization is essential for calcium control of regulated exocytosis
    Article Snippet: Protein expression was verified by Western blot analysis using a mouse anti-Syt1 antibody (Synaptic Systems).

    Mutagenesis:

    Article Title: Vesicle docking and fusion pore modulation by the neuronal calcium sensor Synaptotagmin-1.
    Article Snippet: They were then incubated 505 overnight at 4°C with either mouse anti-Syt1 antibody (1:1000; 105.011, Synaptic Systems) or 506 mouse anti-Syt7 antibody (1:1000; MA5-27654, Synaptic Systems,).

    Article Title: Synaptotagmin oligomerization is essential for calcium control of regulated exocytosis
    Article Snippet: Protein expression was verified by Western blot analysis using a mouse anti-Syt1 antibody (Synaptic Systems).

    Staining:

    Article Title: Vesicle docking and fusion pore modulation by the neuronal calcium sensor Synaptotagmin-1.
    Article Snippet: They were then incubated 505 overnight at 4°C with either mouse anti-Syt1 antibody (1:1000; 105.011, Synaptic Systems) or 506 mouse anti-Syt7 antibody (1:1000; MA5-27654, Synaptic Systems,).

    Article Title: Synaptotagmin oligomerization is essential for calcium control of regulated exocytosis
    Article Snippet: Protein expression was verified by Western blot analysis using a mouse anti-Syt1 antibody (Synaptic Systems).

    Binding Assay:

    Article Title: Vesicle docking and fusion pore modulation by the neuronal calcium sensor Synaptotagmin-1.
    Article Snippet: They were then incubated 505 overnight at 4°C with either mouse anti-Syt1 antibody (1:1000; 105.011, Synaptic Systems) or 506 mouse anti-Syt7 antibody (1:1000; MA5-27654, Synaptic Systems,).

    Article Title: Synaptotagmin oligomerization is essential for calcium control of regulated exocytosis
    Article Snippet: Protein expression was verified by Western blot analysis using a mouse anti-Syt1 antibody (Synaptic Systems).

    Labeling:

    Article Title: Vesicle docking and fusion pore modulation by the neuronal calcium sensor Synaptotagmin-1.
    Article Snippet: They were then incubated 505 overnight at 4°C with either mouse anti-Syt1 antibody (1:1000; 105.011, Synaptic Systems) or 506 mouse anti-Syt7 antibody (1:1000; MA5-27654, Synaptic Systems,).

    Article Title: Synaptotagmin oligomerization is essential for calcium control of regulated exocytosis
    Article Snippet: Protein expression was verified by Western blot analysis using a mouse anti-Syt1 antibody (Synaptic Systems).

    Residue:

    Article Title: Vesicle docking and fusion pore modulation by the neuronal calcium sensor Synaptotagmin-1.
    Article Snippet: They were then incubated 505 overnight at 4°C with either mouse anti-Syt1 antibody (1:1000; 105.011, Synaptic Systems) or 506 mouse anti-Syt7 antibody (1:1000; MA5-27654, Synaptic Systems,).

    Article Title: Synaptotagmin oligomerization is essential for calcium control of regulated exocytosis
    Article Snippet: Protein expression was verified by Western blot analysis using a mouse anti-Syt1 antibody (Synaptic Systems).

    Membrane:

    Article Title: Vesicle docking and fusion pore modulation by the neuronal calcium sensor Synaptotagmin-1.
    Article Snippet: They were then incubated 505 overnight at 4°C with either mouse anti-Syt1 antibody (1:1000; 105.011, Synaptic Systems) or 506 mouse anti-Syt7 antibody (1:1000; MA5-27654, Synaptic Systems,).

    Article Title: Synaptotagmin oligomerization is essential for calcium control of regulated exocytosis
    Article Snippet: Protein expression was verified by Western blot analysis using a mouse anti-Syt1 antibody (Synaptic Systems).

    Control:

    Article Title: Vesicle docking and fusion pore modulation by the neuronal calcium sensor Synaptotagmin-1.
    Article Snippet: They were then incubated 505 overnight at 4°C with either mouse anti-Syt1 antibody (1:1000; 105.011, Synaptic Systems) or 506 mouse anti-Syt7 antibody (1:1000; MA5-27654, Synaptic Systems,).

    Article Title: Synaptotagmin oligomerization is essential for calcium control of regulated exocytosis
    Article Snippet: Protein expression was verified by Western blot analysis using a mouse anti-Syt1 antibody (Synaptic Systems).

    Immunofluorescence:

    Article Title: Vesicle docking and fusion pore modulation by the neuronal calcium sensor Synaptotagmin-1.
    Article Snippet: They were then incubated 505 overnight at 4°C with either mouse anti-Syt1 antibody (1:1000; 105.011, Synaptic Systems) or 506 mouse anti-Syt7 antibody (1:1000; MA5-27654, Synaptic Systems,).

    Article Title: Synaptotagmin oligomerization is essential for calcium control of regulated exocytosis
    Article Snippet: Protein expression was verified by Western blot analysis using a mouse anti-Syt1 antibody (Synaptic Systems).

    Recombinant:

    Article Title: Vesicle docking and fusion pore modulation by the neuronal calcium sensor Synaptotagmin-1.
    Article Snippet: They were then incubated 505 overnight at 4°C with either mouse anti-Syt1 antibody (1:1000; 105.011, Synaptic Systems) or 506 mouse anti-Syt7 antibody (1:1000; MA5-27654, Synaptic Systems,).

    Article Title: Synaptotagmin oligomerization is essential for calcium control of regulated exocytosis
    Article Snippet: Protein expression was verified by Western blot analysis using a mouse anti-Syt1 antibody (Synaptic Systems).

    Imaging:

    Article Title: Vesicle docking and fusion pore modulation by the neuronal calcium sensor Synaptotagmin-1.
    Article Snippet: They were then incubated 505 overnight at 4°C with either mouse anti-Syt1 antibody (1:1000; 105.011, Synaptic Systems) or 506 mouse anti-Syt7 antibody (1:1000; MA5-27654, Synaptic Systems,).

    Article Title: Synaptotagmin oligomerization is essential for calcium control of regulated exocytosis
    Article Snippet: Protein expression was verified by Western blot analysis using a mouse anti-Syt1 antibody (Synaptic Systems).

    MANN-WHITNEY:

    Article Title: Vesicle docking and fusion pore modulation by the neuronal calcium sensor Synaptotagmin-1.
    Article Snippet: They were then incubated 505 overnight at 4°C with either mouse anti-Syt1 antibody (1:1000; 105.011, Synaptic Systems) or 506 mouse anti-Syt7 antibody (1:1000; MA5-27654, Synaptic Systems,).

    Article Title: Synaptotagmin oligomerization is essential for calcium control of regulated exocytosis
    Article Snippet: Protein expression was verified by Western blot analysis using a mouse anti-Syt1 antibody (Synaptic Systems).

    Blocking Assay:

    Article Title: Vesicle docking and fusion pore modulation by the neuronal calcium sensor Synaptotagmin-1.
    Article Snippet: They were then incubated 505 overnight at 4°C with either mouse anti-Syt1 antibody (1:1000; 105.011, Synaptic Systems) or 506 mouse anti-Syt7 antibody (1:1000; MA5-27654, Synaptic Systems,).

    Article Title: Synaptotagmin oligomerization is essential for calcium control of regulated exocytosis
    Article Snippet: Protein expression was verified by Western blot analysis using a mouse anti-Syt1 antibody (Synaptic Systems).

    Activation Assay:

    Article Title: Vesicle docking and fusion pore modulation by the neuronal calcium sensor Synaptotagmin-1.
    Article Snippet: They were then incubated 505 overnight at 4°C with either mouse anti-Syt1 antibody (1:1000; 105.011, Synaptic Systems) or 506 mouse anti-Syt7 antibody (1:1000; MA5-27654, Synaptic Systems,).

    Article Title: Synaptotagmin oligomerization is essential for calcium control of regulated exocytosis
    Article Snippet: Protein expression was verified by Western blot analysis using a mouse anti-Syt1 antibody (Synaptic Systems).


    Similar Products

    90
    Synaptic Systems mouse anti-syt1 antibody cat# 105 311
    Mouse Anti Syt1 Antibody Cat# 105 311, supplied by Synaptic Systems, used in various techniques. Bioz Stars score: 90/100, based on 1 PubMed citations. ZERO BIAS - scores, article reviews, protocol conditions and more
    https://www.bioz.com/product/mouse+anti-syt1+antibody/synaptophysin+antibody/pmc11933353-49-14-20
    Average 90 stars, based on 1 article reviews
    mouse anti-syt1 antibody cat# 105 311 - by Bioz Stars, 2026-09
    90/100 stars
      Buy from Supplier

    90
    Synaptic Systems mouse anti-syt1 antibody
    Mouse Anti Syt1 Antibody, supplied by Synaptic Systems, used in various techniques. Bioz Stars score: 90/100, based on 1 PubMed citations. ZERO BIAS - scores, article reviews, protocol conditions and more
    https://www.bioz.com/product/mouse+anti-syt1+antibody/synaptophysin+antibody/pm39719826-280-10-15
    Average 90 stars, based on 1 article reviews
    mouse anti-syt1 antibody - by Bioz Stars, 2026-09
    90/100 stars
      Buy from Supplier

    90
    Synaptic Systems antibody mouse anti-syt1
    A. Schematic structure of <t>Syt1</t> with its polybasic patches, marked as purple discs. The C2A and C2B domains are rendered using bioRender ( bioRender.com ) from the Protein Data Bank entries, 3F04 and 1K5W, respectively. The rest of the molecule is schematically drawn using bioRender ( bioRender.com ). B . Immunofluorescence of BON cells using anti-Syt1 antibodies. Cell nuclei were labeled with Hoechst dye (blue). Syt1 immunofluorescence (green) appears punctate, consistent with the distribution of DCVs. C . An enlarged view of the red boxed region in B, showing a cluster of puncta. D . No immunofluorescence against Syt7 could be detected in BON cells. E . As a positive control, HEK293T cells transiently expressing Syt7 displayed robust Syt7 immunofluorescence.
    Antibody Mouse Anti Syt1, supplied by Synaptic Systems, used in various techniques. Bioz Stars score: 90/100, based on 1 PubMed citations. ZERO BIAS - scores, article reviews, protocol conditions and more
    https://www.bioz.com/product/mouse+anti-syt1+antibody/synaptophysin+antibody/bio_rxiv__2024__09__12__612660-241-9-14
    Average 90 stars, based on 1 article reviews
    antibody mouse anti-syt1 - by Bioz Stars, 2026-09
    90/100 stars
      Buy from Supplier

    92
    R&D Systems mouse monoclonal anti syt1 antibody
    FIGURE 1 Whole mount preparation of the carotid sinus with double immunofluorescence for P2 × 3 (green) and <t>Syt1</t> (red). (a) Low magnification view of the carotid sinus showing P2 × 3-immunoreactive flower-spray nerve endings. Syt1 immunoreactivity is shown in flower-spray endings and in the network of varicose nerve fibers. (b and c) Three-dimensional view of the basal surface of the terminal part of the flower-spray ending indicated in rectangle in Panel a. Arrows indicate thick parent axon for the ending. Panel b shows flower-spray endings could be distinguished from network of thin varicose nerve fibers with Syn1 immunoreactivity. (d–f) Higher magnification view of the rectangle in Panel a. (d) Punctate P2 × 3 immunoreactivity is shown in the terminal part of the endings. (e) Syt1 immunoreactivity is shown as smaller dots in the terminal parts. (f) The merged figure shows that P2 × 3 and Syt1 immunoreactivities are distinct from each other.
    Mouse Monoclonal Anti Syt1 Antibody, supplied by R&D Systems, used in various techniques. Bioz Stars score: 92/100, based on 1 PubMed citations. ZERO BIAS - scores, article reviews, protocol conditions and more
    https://www.bioz.com/product/mouse+anti-syt1+antibody/Rat+Synaptotagmin-1+Antibody/pm38980116-52-1-8
    Average 92 stars, based on 1 article reviews
    mouse monoclonal anti syt1 antibody - by Bioz Stars, 2026-09
    92/100 stars
      Buy from Supplier

    93
    Proteintech mouse anti e syt1
    FIGURE 1 Whole mount preparation of the carotid sinus with double immunofluorescence for P2 × 3 (green) and <t>Syt1</t> (red). (a) Low magnification view of the carotid sinus showing P2 × 3-immunoreactive flower-spray nerve endings. Syt1 immunoreactivity is shown in flower-spray endings and in the network of varicose nerve fibers. (b and c) Three-dimensional view of the basal surface of the terminal part of the flower-spray ending indicated in rectangle in Panel a. Arrows indicate thick parent axon for the ending. Panel b shows flower-spray endings could be distinguished from network of thin varicose nerve fibers with Syn1 immunoreactivity. (d–f) Higher magnification view of the rectangle in Panel a. (d) Punctate P2 × 3 immunoreactivity is shown in the terminal part of the endings. (e) Syt1 immunoreactivity is shown as smaller dots in the terminal parts. (f) The merged figure shows that P2 × 3 and Syt1 immunoreactivities are distinct from each other.
    Mouse Anti E Syt1, supplied by Proteintech, used in various techniques. Bioz Stars score: 93/100, based on 1 PubMed citations. ZERO BIAS - scores, article reviews, protocol conditions and more
    https://www.bioz.com/product/mouse+anti-syt1+antibody/ESYT1+Antibody/pmc09527316-208-27-30
    Average 93 stars, based on 1 article reviews
    mouse anti e syt1 - by Bioz Stars, 2026-09
    93/100 stars
      Buy from Supplier

    90
    Alomone Labs anti nuclear factor kappa b nf κb p65 p65 f 6 mouse mab
    FIGURE 1 Whole mount preparation of the carotid sinus with double immunofluorescence for P2 × 3 (green) and <t>Syt1</t> (red). (a) Low magnification view of the carotid sinus showing P2 × 3-immunoreactive flower-spray nerve endings. Syt1 immunoreactivity is shown in flower-spray endings and in the network of varicose nerve fibers. (b and c) Three-dimensional view of the basal surface of the terminal part of the flower-spray ending indicated in rectangle in Panel a. Arrows indicate thick parent axon for the ending. Panel b shows flower-spray endings could be distinguished from network of thin varicose nerve fibers with Syn1 immunoreactivity. (d–f) Higher magnification view of the rectangle in Panel a. (d) Punctate P2 × 3 immunoreactivity is shown in the terminal part of the endings. (e) Syt1 immunoreactivity is shown as smaller dots in the terminal parts. (f) The merged figure shows that P2 × 3 and Syt1 immunoreactivities are distinct from each other.
    Anti Nuclear Factor Kappa B Nf κb P65 P65 F 6 Mouse Mab, supplied by Alomone Labs, used in various techniques. Bioz Stars score: 90/100, based on 1 PubMed citations. ZERO BIAS - scores, article reviews, protocol conditions and more
    https://www.bioz.com/product/mouse+anti-syt1+antibody/Anti-Synaptotagmin-1+(SYT1)+Antibody/pm32077170-33-20-48
    Average 90 stars, based on 1 article reviews
    anti nuclear factor kappa b nf κb p65 p65 f 6 mouse mab - by Bioz Stars, 2026-09
    90/100 stars
      Buy from Supplier

    94
    Proteintech rabbit polyclonal anti mouse syt1 antibody
    FIGURE 1 Whole mount preparation of the carotid sinus with double immunofluorescence for P2 × 3 (green) and <t>Syt1</t> (red). (a) Low magnification view of the carotid sinus showing P2 × 3-immunoreactive flower-spray nerve endings. Syt1 immunoreactivity is shown in flower-spray endings and in the network of varicose nerve fibers. (b and c) Three-dimensional view of the basal surface of the terminal part of the flower-spray ending indicated in rectangle in Panel a. Arrows indicate thick parent axon for the ending. Panel b shows flower-spray endings could be distinguished from network of thin varicose nerve fibers with Syn1 immunoreactivity. (d–f) Higher magnification view of the rectangle in Panel a. (d) Punctate P2 × 3 immunoreactivity is shown in the terminal part of the endings. (e) Syt1 immunoreactivity is shown as smaller dots in the terminal parts. (f) The merged figure shows that P2 × 3 and Syt1 immunoreactivities are distinct from each other.
    Rabbit Polyclonal Anti Mouse Syt1 Antibody, supplied by Proteintech, used in various techniques. Bioz Stars score: 94/100, based on 1 PubMed citations. ZERO BIAS - scores, article reviews, protocol conditions and more
    https://www.bioz.com/product/mouse+anti-syt1+antibody/Synaptotagmin-1+Antibody/pm32771460-84-5-11
    Average 94 stars, based on 1 article reviews
    rabbit polyclonal anti mouse syt1 antibody - by Bioz Stars, 2026-09
    94/100 stars
      Buy from Supplier

    90
    Synaptic Systems biotinylated monoclonal mouse anti-syt1 antibody 105 311bt
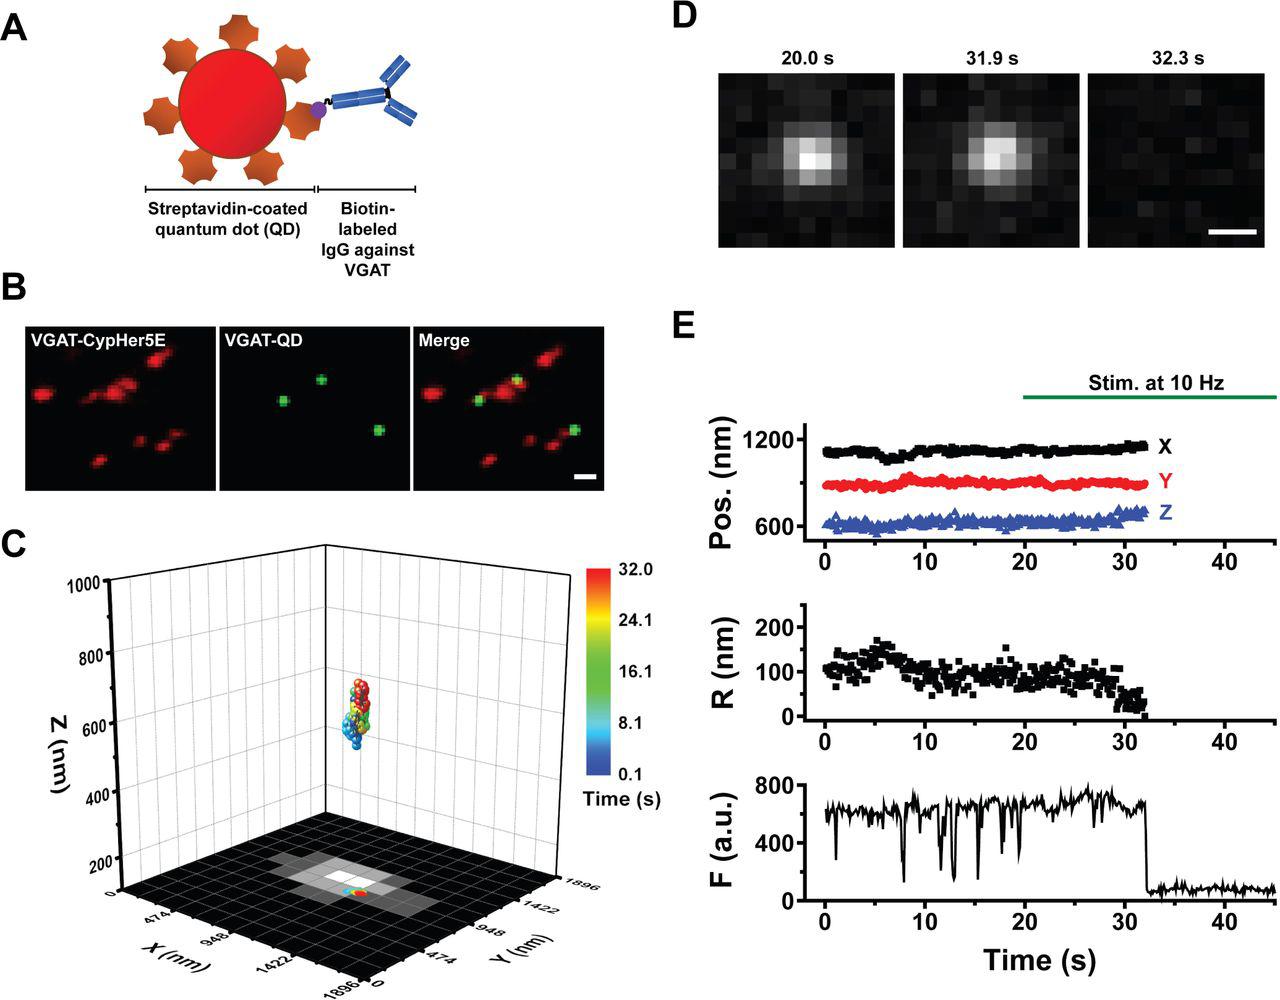
    (A) Schematic diagram depicting a streptavidin-conjugated quantum dot (QD) conjugated to <t>biotinylated</t> antibodies against the luminal domain of VGAT. (B) Colocalization of VGAT-QD‒loaded inhibitory vesicles (green) and CypHer5E-VGAT‒labeled presynaptic boutons (red) in cultured hippocampal neurons. Scale bar: 1 µm. (C) Three-dimensional trajectory of a VGAT-QD‒loaded inhibitory vesicle overlaid on the x - y plane of a CypHer5E-VGAT‒ labeled presynaptic bouton. The color bar represents elapsed time; electrical stimulation (10 Hz) started at 20 s, and the vesicle underwent exocytosis at 32.0 s. (D) Fluorescence images of the VGAT-QD‒loaded vesicle shown in panel C taken at the indicated times. Scale bar: 0.5 µm. (E) Three-dimensional position, radial distance from the momentary position to the fusion site (R), and fluorescence intensity (F) of the VGAT-QD‒loaded vesicle shown in panel C. Note the photoblinking events (e.g., at approximately 8 s, 13 s and 15 s), confirming the presence of one QD inside the vesicle. Electrical stimuli (10 Hz) were applied for 120 s starting at 20 s (green horizontal bar).
    Biotinylated Monoclonal Mouse Anti Syt1 Antibody 105 311bt, supplied by Synaptic Systems, used in various techniques. Bioz Stars score: 90/100, based on 1 PubMed citations. ZERO BIAS - scores, article reviews, protocol conditions and more
    https://www.bioz.com/product/mouse+anti-syt1+antibody/syt+1+specific+antibody/bio_rxiv__2020__09__21__289314-161-1-8
    Average 90 stars, based on 1 article reviews
    biotinylated monoclonal mouse anti-syt1 antibody 105 311bt - by Bioz Stars, 2026-09
    90/100 stars
      Buy from Supplier

    93
    Santa Cruz Biotechnology mouse anti syt1 2 h 9
    (A) Schematic diagram depicting a streptavidin-conjugated quantum dot (QD) conjugated to <t>biotinylated</t> antibodies against the luminal domain of VGAT. (B) Colocalization of VGAT-QD‒loaded inhibitory vesicles (green) and CypHer5E-VGAT‒labeled presynaptic boutons (red) in cultured hippocampal neurons. Scale bar: 1 µm. (C) Three-dimensional trajectory of a VGAT-QD‒loaded inhibitory vesicle overlaid on the x - y plane of a CypHer5E-VGAT‒ labeled presynaptic bouton. The color bar represents elapsed time; electrical stimulation (10 Hz) started at 20 s, and the vesicle underwent exocytosis at 32.0 s. (D) Fluorescence images of the VGAT-QD‒loaded vesicle shown in panel C taken at the indicated times. Scale bar: 0.5 µm. (E) Three-dimensional position, radial distance from the momentary position to the fusion site (R), and fluorescence intensity (F) of the VGAT-QD‒loaded vesicle shown in panel C. Note the photoblinking events (e.g., at approximately 8 s, 13 s and 15 s), confirming the presence of one QD inside the vesicle. Electrical stimuli (10 Hz) were applied for 120 s starting at 20 s (green horizontal bar).
    Mouse Anti Syt1 2 H 9, supplied by Santa Cruz Biotechnology, used in various techniques. Bioz Stars score: 93/100, based on 1 PubMed citations. ZERO BIAS - scores, article reviews, protocol conditions and more
    https://www.bioz.com/product/mouse+anti-syt1+antibody/Synaptotagmin+I%2FII+Antibody/pmc07168909-192-35-39
    Average 93 stars, based on 1 article reviews
    mouse anti syt1 2 h 9 - by Bioz Stars, 2026-09
    93/100 stars
      Buy from Supplier

    Image Search Results


    A. Schematic structure of Syt1 with its polybasic patches, marked as purple discs. The C2A and C2B domains are rendered using bioRender ( bioRender.com ) from the Protein Data Bank entries, 3F04 and 1K5W, respectively. The rest of the molecule is schematically drawn using bioRender ( bioRender.com ). B . Immunofluorescence of BON cells using anti-Syt1 antibodies. Cell nuclei were labeled with Hoechst dye (blue). Syt1 immunofluorescence (green) appears punctate, consistent with the distribution of DCVs. C . An enlarged view of the red boxed region in B, showing a cluster of puncta. D . No immunofluorescence against Syt7 could be detected in BON cells. E . As a positive control, HEK293T cells transiently expressing Syt7 displayed robust Syt7 immunofluorescence.

    Journal: bioRxiv

    Article Title: Vesicle docking and fusion pore modulation by the neuronal calcium sensor Synaptotagmin-1

    doi: 10.1101/2024.09.12.612660

    Figure Lengend Snippet: A. Schematic structure of Syt1 with its polybasic patches, marked as purple discs. The C2A and C2B domains are rendered using bioRender ( bioRender.com ) from the Protein Data Bank entries, 3F04 and 1K5W, respectively. The rest of the molecule is schematically drawn using bioRender ( bioRender.com ). B . Immunofluorescence of BON cells using anti-Syt1 antibodies. Cell nuclei were labeled with Hoechst dye (blue). Syt1 immunofluorescence (green) appears punctate, consistent with the distribution of DCVs. C . An enlarged view of the red boxed region in B, showing a cluster of puncta. D . No immunofluorescence against Syt7 could be detected in BON cells. E . As a positive control, HEK293T cells transiently expressing Syt7 displayed robust Syt7 immunofluorescence.

    Article Snippet: They were then incubated overnight at 4°C with either mouse anti-Syt1 antibody (1:1000; 105.011, Synaptic Systems) or mouse anti-Syt7 antibody (1:1000; MA5-27654, Synaptic Systems,).

    Techniques: Immunofluorescence, Labeling, Positive Control, Expressing

    A . Domain structures of the Syt1 wild-type and mutant rescue constructs used. B . Western blot (WB) analysis of the constitutive expression of syt1 transgenes in BON cells. A representative result from 3 separate experiments is shown. Scr (scrambled, mock shRNA), KD (knock-down 2), WT (pH-Syt1 WT ), K189 (pH-Syt1 K189–192A ), K326 (pH-Syt1 K326,327A ). The rescue constructs are stably expressed in BON cells constitutively expressing shRNA against syt1 (KD). The rescue constructs with pHluorin migrate slower, allowing relative amounts of expression from native vs. exogenous loci (see C). C. Quantification of the expression of endogenous syt1 vs pH-syt1 rescues, from densitometry analysis of blots as in B. (n=3 blots). 50-60 % of endogenously expressed syt1 is replaced by the expression of pH-syt1 rescue constructs, for a total amount 0.9-1.45 times the amount in the parental cell line. D. Calcium-dependent bulk release of serotonin (5-HT) from BON cells with the genotypes as indicated, from 3 independent experiments. For each genotype, the fraction of total cellular 5-HT released upon stimulation (ionomycin 10 µM, ∼3 s) was calculated, then normalized to release from the parent cell line (src). The error bars represent ± SEM in both C and D. E. Exogenously expressed pH-Syt1 is correctly targeted to DCVs. Confocal images of BON cells stably co-expressing the granule marker NPY-mCherry and pH-Syt1 constructs as indicated. After fixation, cells were permeabilized and pHluorin-Syt1 was detected using Alexa488 labeled anti-Syt1 antibodies. The boxed regions are shown at higher magnification below each panel. The Pearson correlation coefficient was coefficient of 0.718 ± 0.037 (SEM, n=4 images), indicating good co-localization (a value of 1 corresponds to perfect colocalization).

    Journal: bioRxiv

    Article Title: Vesicle docking and fusion pore modulation by the neuronal calcium sensor Synaptotagmin-1

    doi: 10.1101/2024.09.12.612660

    Figure Lengend Snippet: A . Domain structures of the Syt1 wild-type and mutant rescue constructs used. B . Western blot (WB) analysis of the constitutive expression of syt1 transgenes in BON cells. A representative result from 3 separate experiments is shown. Scr (scrambled, mock shRNA), KD (knock-down 2), WT (pH-Syt1 WT ), K189 (pH-Syt1 K189–192A ), K326 (pH-Syt1 K326,327A ). The rescue constructs are stably expressed in BON cells constitutively expressing shRNA against syt1 (KD). The rescue constructs with pHluorin migrate slower, allowing relative amounts of expression from native vs. exogenous loci (see C). C. Quantification of the expression of endogenous syt1 vs pH-syt1 rescues, from densitometry analysis of blots as in B. (n=3 blots). 50-60 % of endogenously expressed syt1 is replaced by the expression of pH-syt1 rescue constructs, for a total amount 0.9-1.45 times the amount in the parental cell line. D. Calcium-dependent bulk release of serotonin (5-HT) from BON cells with the genotypes as indicated, from 3 independent experiments. For each genotype, the fraction of total cellular 5-HT released upon stimulation (ionomycin 10 µM, ∼3 s) was calculated, then normalized to release from the parent cell line (src). The error bars represent ± SEM in both C and D. E. Exogenously expressed pH-Syt1 is correctly targeted to DCVs. Confocal images of BON cells stably co-expressing the granule marker NPY-mCherry and pH-Syt1 constructs as indicated. After fixation, cells were permeabilized and pHluorin-Syt1 was detected using Alexa488 labeled anti-Syt1 antibodies. The boxed regions are shown at higher magnification below each panel. The Pearson correlation coefficient was coefficient of 0.718 ± 0.037 (SEM, n=4 images), indicating good co-localization (a value of 1 corresponds to perfect colocalization).

    Article Snippet: They were then incubated overnight at 4°C with either mouse anti-Syt1 antibody (1:1000; 105.011, Synaptic Systems) or mouse anti-Syt7 antibody (1:1000; MA5-27654, Synaptic Systems,).

    Techniques: Mutagenesis, Construct, Western Blot, Expressing, shRNA, Knockdown, Stable Transfection, Marker, Labeling

    A . Depiction of the experiment. A carbon fibre electrode (CFE) held at 650 mV gently touches a BON cell. Stimulation is performed by pressure-driven superfusion of an ionomycin solution from a micropipette placed nearby (“stim”). The principle of detection and the oxidation reaction are shown schematically. B. Example of an amperometric trace. The cell was stimulated for 3 s by ionomycin application (black bar). Each exocytosis event results in a brief oxidation spike. The spike marked by an * is expanded in the inset. C . Bar plot of the total number of spikes (to t=23 s) averaged over the number of tested cells, including cells that did not respond to stimulation (<5 spikes). N13 is the parent BON cell line, the other symbols are as in . Error bars represent S.E.M. The number of cells tested are indicated above every bar. D . Release kinetics from experiments as in B, plotted as the cumulative number of spikes per cell. Only cells that responded to stimulation (≥5 spikes) were included. Syt1 KD impairs release, pH-Syt1-NPYmCHerry restores release. Rescue with pH-Syt1 K189–192A or pH-Syt1 K326,327A are both defective, especially in light of remaining endogenous WT Syt1. E. Release kinetics as in D, normalized to the maximum number of spikes per cell for every group. There is no detectable delay in release. F . An example of changes induced in intracellular calcium upon stimulation using the calcium indicator Fluo-4. The parental, unlabeled BON N13 cells were used for these experiments to avoid overlap with other fluorescent molecules expressed in the rescued cell lines, but otherwise the conditions were the same as for D.

    Journal: bioRxiv

    Article Title: Vesicle docking and fusion pore modulation by the neuronal calcium sensor Synaptotagmin-1

    doi: 10.1101/2024.09.12.612660

    Figure Lengend Snippet: A . Depiction of the experiment. A carbon fibre electrode (CFE) held at 650 mV gently touches a BON cell. Stimulation is performed by pressure-driven superfusion of an ionomycin solution from a micropipette placed nearby (“stim”). The principle of detection and the oxidation reaction are shown schematically. B. Example of an amperometric trace. The cell was stimulated for 3 s by ionomycin application (black bar). Each exocytosis event results in a brief oxidation spike. The spike marked by an * is expanded in the inset. C . Bar plot of the total number of spikes (to t=23 s) averaged over the number of tested cells, including cells that did not respond to stimulation (<5 spikes). N13 is the parent BON cell line, the other symbols are as in . Error bars represent S.E.M. The number of cells tested are indicated above every bar. D . Release kinetics from experiments as in B, plotted as the cumulative number of spikes per cell. Only cells that responded to stimulation (≥5 spikes) were included. Syt1 KD impairs release, pH-Syt1-NPYmCHerry restores release. Rescue with pH-Syt1 K189–192A or pH-Syt1 K326,327A are both defective, especially in light of remaining endogenous WT Syt1. E. Release kinetics as in D, normalized to the maximum number of spikes per cell for every group. There is no detectable delay in release. F . An example of changes induced in intracellular calcium upon stimulation using the calcium indicator Fluo-4. The parental, unlabeled BON N13 cells were used for these experiments to avoid overlap with other fluorescent molecules expressed in the rescued cell lines, but otherwise the conditions were the same as for D.

    Article Snippet: They were then incubated overnight at 4°C with either mouse anti-Syt1 antibody (1:1000; 105.011, Synaptic Systems) or mouse anti-Syt7 antibody (1:1000; MA5-27654, Synaptic Systems,).

    Techniques: Cell Stimulation

    A . An electron micrograph of Syt1 KD BON cells rescued with pH-Syt1 WT (WT). B-C . Same, for rescue with pH-Syt1 K189–192A (K189, B) or pH-Syt1 K326,327A (K326, C). D. Comparison of DCV areas among the groups ( p = 0.57 for the null hypothesis that the data in each group comes from the same distribution, using the Kruskal-Wallis test). E. Distributions of shortest DCV-PM distances d , for d ≤ 300 nm, for non-stimulated cells, for the groups shown. Labels are the same as in A-C. F . Changes in the DCV-PM distances upon a brief, ∼3s stimulation. The distributions before stimulation are the same as in E, replotted for easier comparison. Samples were prepared from at least two independent cultures.

    Journal: bioRxiv

    Article Title: Vesicle docking and fusion pore modulation by the neuronal calcium sensor Synaptotagmin-1

    doi: 10.1101/2024.09.12.612660

    Figure Lengend Snippet: A . An electron micrograph of Syt1 KD BON cells rescued with pH-Syt1 WT (WT). B-C . Same, for rescue with pH-Syt1 K189–192A (K189, B) or pH-Syt1 K326,327A (K326, C). D. Comparison of DCV areas among the groups ( p = 0.57 for the null hypothesis that the data in each group comes from the same distribution, using the Kruskal-Wallis test). E. Distributions of shortest DCV-PM distances d , for d ≤ 300 nm, for non-stimulated cells, for the groups shown. Labels are the same as in A-C. F . Changes in the DCV-PM distances upon a brief, ∼3s stimulation. The distributions before stimulation are the same as in E, replotted for easier comparison. Samples were prepared from at least two independent cultures.

    Article Snippet: They were then incubated overnight at 4°C with either mouse anti-Syt1 antibody (1:1000; 105.011, Synaptic Systems) or mouse anti-Syt7 antibody (1:1000; MA5-27654, Synaptic Systems,).

    Techniques: Comparison

    A . Schematic of a single amperometric oxidation event (see ). B . Cumulative distribution function (CDF) of maximum spike amplitudes averaged over BON cells expressing Syt1 WT (WT), Syt1 K189–192A (K189), or Syt1 K326,327A (K326). Syt1 WT spikes have lower amplitude on average. See for a summary. C . Cumulative distribution of spike widths at half amplitude for BON cells expressing Syt1 WT , Syt1 K189–192A , or Syt1 K326,327A (symbols as in B). Syt1 WT spikes last longer. D. Cumulative distribution of oxidation charges for individual events for BON cells expressing Syt1 WT , Syt1 K189–192A , or Syt1 K326,327A . No significant difference is found, implying the same amount of 5-HT is released per event for the different conditions. The p -values in B-D are returned from the Kruskal-Wallis test for the null hypothesis that all data come from the same distribution. E. Example of a trace of fusion pore permeability scaled by DCV volume ( g / V ) as a function of time (blue trace). The corresponding amperometric current I ( t ) is shown in red. The integral is carried only to 60% of the total spike duration (see text and Methods). F . Mean g / V for 0-60% of spike duration, averaged over cells in each group. Error bars represent SEM. For WT, K189, and K326 groups, the number of cells (spikes) were 17 (197), 12 (108), 11 (131), respectively. Mean values for every cell were averaged across cells. p = 0.003 and 0.020 for the mean ranks of K189 and K326 data compared against WT (see methods).

    Journal: bioRxiv

    Article Title: Vesicle docking and fusion pore modulation by the neuronal calcium sensor Synaptotagmin-1

    doi: 10.1101/2024.09.12.612660

    Figure Lengend Snippet: A . Schematic of a single amperometric oxidation event (see ). B . Cumulative distribution function (CDF) of maximum spike amplitudes averaged over BON cells expressing Syt1 WT (WT), Syt1 K189–192A (K189), or Syt1 K326,327A (K326). Syt1 WT spikes have lower amplitude on average. See for a summary. C . Cumulative distribution of spike widths at half amplitude for BON cells expressing Syt1 WT , Syt1 K189–192A , or Syt1 K326,327A (symbols as in B). Syt1 WT spikes last longer. D. Cumulative distribution of oxidation charges for individual events for BON cells expressing Syt1 WT , Syt1 K189–192A , or Syt1 K326,327A . No significant difference is found, implying the same amount of 5-HT is released per event for the different conditions. The p -values in B-D are returned from the Kruskal-Wallis test for the null hypothesis that all data come from the same distribution. E. Example of a trace of fusion pore permeability scaled by DCV volume ( g / V ) as a function of time (blue trace). The corresponding amperometric current I ( t ) is shown in red. The integral is carried only to 60% of the total spike duration (see text and Methods). F . Mean g / V for 0-60% of spike duration, averaged over cells in each group. Error bars represent SEM. For WT, K189, and K326 groups, the number of cells (spikes) were 17 (197), 12 (108), 11 (131), respectively. Mean values for every cell were averaged across cells. p = 0.003 and 0.020 for the mean ranks of K189 and K326 data compared against WT (see methods).

    Article Snippet: They were then incubated overnight at 4°C with either mouse anti-Syt1 antibody (1:1000; 105.011, Synaptic Systems) or mouse anti-Syt7 antibody (1:1000; MA5-27654, Synaptic Systems,).

    Techniques: Expressing, Permeability

    Undocked (U) DCVs reversibly tether (T) to the PM. Initial tethering is mediated by large tethering molecules such as CAPS and/or Munc13, which also assist subsequent stages of DCV maturation at the PM. Docked DCVs (D) are closer to the PM. Docking involves Syt1 and likely SNARE proteins and acidic lipids in the inner leaflet of the PM. An elevation of [Ca 2+ ] i leads to fusion (F). Release kinetics and extent depend on the amount of docked DCVs. If the docked population is sparse, the release rate may be limited by the rate of docking.

    Journal: bioRxiv

    Article Title: Vesicle docking and fusion pore modulation by the neuronal calcium sensor Synaptotagmin-1

    doi: 10.1101/2024.09.12.612660

    Figure Lengend Snippet: Undocked (U) DCVs reversibly tether (T) to the PM. Initial tethering is mediated by large tethering molecules such as CAPS and/or Munc13, which also assist subsequent stages of DCV maturation at the PM. Docked DCVs (D) are closer to the PM. Docking involves Syt1 and likely SNARE proteins and acidic lipids in the inner leaflet of the PM. An elevation of [Ca 2+ ] i leads to fusion (F). Release kinetics and extent depend on the amount of docked DCVs. If the docked population is sparse, the release rate may be limited by the rate of docking.

    Article Snippet: They were then incubated overnight at 4°C with either mouse anti-Syt1 antibody (1:1000; 105.011, Synaptic Systems) or mouse anti-Syt7 antibody (1:1000; MA5-27654, Synaptic Systems,).

    Techniques:

    FIGURE 1 Whole mount preparation of the carotid sinus with double immunofluorescence for P2 × 3 (green) and Syt1 (red). (a) Low magnification view of the carotid sinus showing P2 × 3-immunoreactive flower-spray nerve endings. Syt1 immunoreactivity is shown in flower-spray endings and in the network of varicose nerve fibers. (b and c) Three-dimensional view of the basal surface of the terminal part of the flower-spray ending indicated in rectangle in Panel a. Arrows indicate thick parent axon for the ending. Panel b shows flower-spray endings could be distinguished from network of thin varicose nerve fibers with Syn1 immunoreactivity. (d–f) Higher magnification view of the rectangle in Panel a. (d) Punctate P2 × 3 immunoreactivity is shown in the terminal part of the endings. (e) Syt1 immunoreactivity is shown as smaller dots in the terminal parts. (f) The merged figure shows that P2 × 3 and Syt1 immunoreactivities are distinct from each other.

    Journal: The Journal of comparative neurology

    Article Title: Three-Dimensional Ultrastructure of Flower-Spray Nerve Endings in the Rat Carotid Sinus.

    doi: 10.1002/cne.25654

    Figure Lengend Snippet: FIGURE 1 Whole mount preparation of the carotid sinus with double immunofluorescence for P2 × 3 (green) and Syt1 (red). (a) Low magnification view of the carotid sinus showing P2 × 3-immunoreactive flower-spray nerve endings. Syt1 immunoreactivity is shown in flower-spray endings and in the network of varicose nerve fibers. (b and c) Three-dimensional view of the basal surface of the terminal part of the flower-spray ending indicated in rectangle in Panel a. Arrows indicate thick parent axon for the ending. Panel b shows flower-spray endings could be distinguished from network of thin varicose nerve fibers with Syn1 immunoreactivity. (d–f) Higher magnification view of the rectangle in Panel a. (d) Punctate P2 × 3 immunoreactivity is shown in the terminal part of the endings. (e) Syt1 immunoreactivity is shown as smaller dots in the terminal parts. (f) The merged figure shows that P2 × 3 and Syt1 immunoreactivities are distinct from each other.

    Article Snippet: A mouse monoclonal anti-Syt1 antibody (clone ASV48, MAB4364, R&D Systems, Minneapolis, MN, USA; RRID AB_2199304) was raised against the rat brain synaptic plasmamembrane (Matthew, Tsavaler, and Reichardt 1981).

    Techniques: Immunofluorescence

    (A) Schematic diagram depicting a streptavidin-conjugated quantum dot (QD) conjugated to biotinylated antibodies against the luminal domain of VGAT. (B) Colocalization of VGAT-QD‒loaded inhibitory vesicles (green) and CypHer5E-VGAT‒labeled presynaptic boutons (red) in cultured hippocampal neurons. Scale bar: 1 µm. (C) Three-dimensional trajectory of a VGAT-QD‒loaded inhibitory vesicle overlaid on the x - y plane of a CypHer5E-VGAT‒ labeled presynaptic bouton. The color bar represents elapsed time; electrical stimulation (10 Hz) started at 20 s, and the vesicle underwent exocytosis at 32.0 s. (D) Fluorescence images of the VGAT-QD‒loaded vesicle shown in panel C taken at the indicated times. Scale bar: 0.5 µm. (E) Three-dimensional position, radial distance from the momentary position to the fusion site (R), and fluorescence intensity (F) of the VGAT-QD‒loaded vesicle shown in panel C. Note the photoblinking events (e.g., at approximately 8 s, 13 s and 15 s), confirming the presence of one QD inside the vesicle. Electrical stimuli (10 Hz) were applied for 120 s starting at 20 s (green horizontal bar).

    Journal: bioRxiv

    Article Title: Inhibitory synaptic vesicles have unique dynamics and exocytosis properties

    doi: 10.1101/2020.09.21.289314

    Figure Lengend Snippet: (A) Schematic diagram depicting a streptavidin-conjugated quantum dot (QD) conjugated to biotinylated antibodies against the luminal domain of VGAT. (B) Colocalization of VGAT-QD‒loaded inhibitory vesicles (green) and CypHer5E-VGAT‒labeled presynaptic boutons (red) in cultured hippocampal neurons. Scale bar: 1 µm. (C) Three-dimensional trajectory of a VGAT-QD‒loaded inhibitory vesicle overlaid on the x - y plane of a CypHer5E-VGAT‒ labeled presynaptic bouton. The color bar represents elapsed time; electrical stimulation (10 Hz) started at 20 s, and the vesicle underwent exocytosis at 32.0 s. (D) Fluorescence images of the VGAT-QD‒loaded vesicle shown in panel C taken at the indicated times. Scale bar: 0.5 µm. (E) Three-dimensional position, radial distance from the momentary position to the fusion site (R), and fluorescence intensity (F) of the VGAT-QD‒loaded vesicle shown in panel C. Note the photoblinking events (e.g., at approximately 8 s, 13 s and 15 s), confirming the presence of one QD inside the vesicle. Electrical stimuli (10 Hz) were applied for 120 s starting at 20 s (green horizontal bar).

    Article Snippet: The biotinylated monoclonal mouse anti-Syt1 antibody (105 311BT, Synaptic Systems) or the biotinylated anti-VGAT antibody (131 103CpH, Synaptic Systems) was conjugated to streptavidin-conjugated quantum dots (cat. A10196, Thermo Fisher Scientific), and vesicles were loaded as described previously ( ).

    Techniques: Cell Culture, Labeling, Fluorescence

    Cumulative distribution of the net displacement between the initial location and fusion site (A) , fusion time (B) , and total length traveled (C) for VGAT-QD‒labeled synaptic vesicles (n = 80 vesicles) and Syt1-QD‒loaded synaptic vesicles (n = 49 vesicles). * p <0.05, ** p <0.01, and NS, not significant (Kolmogorov-Smirnov test (K-S test)).

    Journal: bioRxiv

    Article Title: Inhibitory synaptic vesicles have unique dynamics and exocytosis properties

    doi: 10.1101/2020.09.21.289314

    Figure Lengend Snippet: Cumulative distribution of the net displacement between the initial location and fusion site (A) , fusion time (B) , and total length traveled (C) for VGAT-QD‒labeled synaptic vesicles (n = 80 vesicles) and Syt1-QD‒loaded synaptic vesicles (n = 49 vesicles). * p <0.05, ** p <0.01, and NS, not significant (Kolmogorov-Smirnov test (K-S test)).

    Article Snippet: The biotinylated monoclonal mouse anti-Syt1 antibody (105 311BT, Synaptic Systems) or the biotinylated anti-VGAT antibody (131 103CpH, Synaptic Systems) was conjugated to streptavidin-conjugated quantum dots (cat. A10196, Thermo Fisher Scientific), and vesicles were loaded as described previously ( ).

    Techniques:

    (A) Fusion time is plotted against the net displacement; each symbol represents an individual VGAT-QD‒loaded inhibitory vesicle, and the solid red line represents the linear regression (Pearson’s r = 0.77). (B) Cumulative distribution of net velocity measured for VGAT-QD‒labeled synaptic vesicles and Syt1-QD‒loaded synaptic vesicles. (C) Fusion time is plotted against the total travel length; each symbol represents an individual VGAT-QD‒loaded inhibitory vesicle, and the solid red line represents the linear regression (Pearson’s r = 0.94). (D) Cumulative distribution of vesicle speed measured for VGAT-QD‒labeled synaptic vesicles and Syt1-QD‒loaded synaptic vesicles. ** p <0.01 and NS, not significant (K-S test).

    Journal: bioRxiv

    Article Title: Inhibitory synaptic vesicles have unique dynamics and exocytosis properties

    doi: 10.1101/2020.09.21.289314

    Figure Lengend Snippet: (A) Fusion time is plotted against the net displacement; each symbol represents an individual VGAT-QD‒loaded inhibitory vesicle, and the solid red line represents the linear regression (Pearson’s r = 0.77). (B) Cumulative distribution of net velocity measured for VGAT-QD‒labeled synaptic vesicles and Syt1-QD‒loaded synaptic vesicles. (C) Fusion time is plotted against the total travel length; each symbol represents an individual VGAT-QD‒loaded inhibitory vesicle, and the solid red line represents the linear regression (Pearson’s r = 0.94). (D) Cumulative distribution of vesicle speed measured for VGAT-QD‒labeled synaptic vesicles and Syt1-QD‒loaded synaptic vesicles. ** p <0.01 and NS, not significant (K-S test).

    Article Snippet: The biotinylated monoclonal mouse anti-Syt1 antibody (105 311BT, Synaptic Systems) or the biotinylated anti-VGAT antibody (131 103CpH, Synaptic Systems) was conjugated to streptavidin-conjugated quantum dots (cat. A10196, Thermo Fisher Scientific), and vesicles were loaded as described previously ( ).

    Techniques:

    (A) Fluorescence images taken at the indicated times for an inhibitory vesicle loaded with a VGAT-conjugated QD; electrical stimuli (10 Hz) were applied at 20 s. The intersection of the perpendicular lines marked the position before the first fusion. Scale bar: 0.5 μm. (B) Three-dimensional position, radial distance (R), and fluorescence (F) of a VGAT-QD‒ loaded vesicle that underwent kiss-and-run (K&R) fusion (red arrow) followed by full-collapse fusion (FCF, blue arrow). Electrical stimuli (10 Hz) were applied for 120 s starting at 20 s (green horizontal bar). (C) Average normalized fluorescence intensity traces (with SEM) time-aligned to the first fusion event for vesicles that underwent full-collapse fusion (FCF) (C1), vesicles that underwent kiss-and-run (K&R) fusion followed by FCF (C2), and vesicles that underwent K&R fusion but never underwent FCF (C3). The dotted horizontal line represents a normalized fluorescence intensity value of 0.12, (the expected normalized fluorescence right after full-collapse fusion). (D) Relative distribution of the fusion modes measured in VGAT-QD‒labeled vesicles (D1) and Syt1-QD‒loaded vesicles (D2) that underwent exocytosis, showing that 65% and 27% of vesicles, respectively, underwent K&R fusion. (E-F) Cumulative distribution of total travel length for inhibitory and excitatory vesicles that underwent either FCF (E) or K&R fusion (F). (G-H) Cumulative distribution of fusion time for inhibitory and excitatory vesicles that underwent either FCF (G) or K&R fusion (H). * p <0.05, ** p <0.01, and NS, not significant (K-S test).

    Journal: bioRxiv

    Article Title: Inhibitory synaptic vesicles have unique dynamics and exocytosis properties

    doi: 10.1101/2020.09.21.289314

    Figure Lengend Snippet: (A) Fluorescence images taken at the indicated times for an inhibitory vesicle loaded with a VGAT-conjugated QD; electrical stimuli (10 Hz) were applied at 20 s. The intersection of the perpendicular lines marked the position before the first fusion. Scale bar: 0.5 μm. (B) Three-dimensional position, radial distance (R), and fluorescence (F) of a VGAT-QD‒ loaded vesicle that underwent kiss-and-run (K&R) fusion (red arrow) followed by full-collapse fusion (FCF, blue arrow). Electrical stimuli (10 Hz) were applied for 120 s starting at 20 s (green horizontal bar). (C) Average normalized fluorescence intensity traces (with SEM) time-aligned to the first fusion event for vesicles that underwent full-collapse fusion (FCF) (C1), vesicles that underwent kiss-and-run (K&R) fusion followed by FCF (C2), and vesicles that underwent K&R fusion but never underwent FCF (C3). The dotted horizontal line represents a normalized fluorescence intensity value of 0.12, (the expected normalized fluorescence right after full-collapse fusion). (D) Relative distribution of the fusion modes measured in VGAT-QD‒labeled vesicles (D1) and Syt1-QD‒loaded vesicles (D2) that underwent exocytosis, showing that 65% and 27% of vesicles, respectively, underwent K&R fusion. (E-F) Cumulative distribution of total travel length for inhibitory and excitatory vesicles that underwent either FCF (E) or K&R fusion (F). (G-H) Cumulative distribution of fusion time for inhibitory and excitatory vesicles that underwent either FCF (G) or K&R fusion (H). * p <0.05, ** p <0.01, and NS, not significant (K-S test).

    Article Snippet: The biotinylated monoclonal mouse anti-Syt1 antibody (105 311BT, Synaptic Systems) or the biotinylated anti-VGAT antibody (131 103CpH, Synaptic Systems) was conjugated to streptavidin-conjugated quantum dots (cat. A10196, Thermo Fisher Scientific), and vesicles were loaded as described previously ( ).

    Techniques: Fluorescence